Velocity 2015 (Santa Clara): The Good Parts
This week, I crossed a bucket list conference off by attending Velocity. Velocity is one of the premier performance focused conferences for the web industry and I was lucky to be able to hear talks by some of the best in the business. I made a major effort to take notes on many of the talks and found that I had amassed a wealth of information by the end of the conference. I wanted to document this for my future self and thought I might share some of this knowledge with the rest of the world while I'm at it.
What follows are bits of information from what I considered to be the best talks of the conference that I attended. Unfortunately, with the many tracks at the conference, I could only attend about 20% of the talks. Even so, I was able to gain a lot of useful knowledge and feel inspired to continue making the web faster after attending the conference.
Andy Davies and Simon Hearne: What are third-party components doing to your site?
It's no shock that third party components can cause performance problems for websites. Well, Andy and Simon shocked the hell out of me with the way that they demonstrated, through client experiences and research, just how bad these third party scripts really are. I've always loved Andy's emphasis on research and have learned a lot from his work (Simon appears to be cut from the same cloth, but I only learned of him during this talk). As an example, Andy and Simon discussed the impact of Multivariate Testing (MVT; closely related to A/B testing) on websites. Through examining HTTPArchive data, they found that sites that load scripts for the purpose of MVT have higher Speed Index (i.e., slower perceived performance) than sites that don't load such scripts. Further, they discussed third party components that load fourth party components, that load fifth party components, etc. You never know what these parties are loading on your site and they require constant vigilance and monitoring.
Andy and Simon told a few stories about how such components have broken functionality on client sites (e.g., MVT script not loading caused a login page to be missing form buttons). They use synthetic performance testing tools to try to detect a class of these issues whereby scripts are loading slowly or not loading at all. They even discussed ideas about automated detection of these events leading to removing the scripts from the site until the issue is resolved. This idea underscored the importance of using these third party components as progressive enhancement in order to allow your site to function without them in place.
During their talk they pointed to a number of tools that help with auditing and diagnosing issues with third party components. I love how actionable these tools are. Here are some of the gems:
- Request Map Generator: Built by Simon, this tools shows all of the third party domains that are loaded on a site. It helps you determine the chain of scripts that are loaded to more easily discovery which third party components are loading the fourth and fifth party components and so on.
- Web Performance Heat Map Generator: Another Simon special, the Heat Map tool shows the areas of your site that are taking the longest to load. This tool helps you spot potential third party widgets that are slow to load on your site (as well as any first party slow spots). Simon talks more about it on his blog.
- JS Manners: A self-described "YSlow for widgets" that helps audit third party scripts to determine if there might be security risks, performance issues, or compatibility problems.
- SPOF-o-matic: A Chrome extension by WebPageTest.org creator Patrick Meenan for detecting and simulating Single Points of Failure (SPOF) on your site.
- Ghostery: Andy and Simon recommended using Ghostery as a quick way to get a look at all of the tracking code your site is running. I have used the tool to block tracking code in the past, but never thought to use it as a tool for auditing my own work. It's a really clever way to get a quick look at tracking code you may not realize that you are loading.
I've always hated third party components on sites, but understand that they are often necessary. Andy and Simon's talk gave me a clear path toward beginning to audit and understand exactly how these components are affecting my site. I just love a talk that is so actionable.
- Slides: http://www.slideshare.net/simonhearne/what-are-thirdpartiy-components-doing-to-your-site
- Twitter: @AndyDavies / @simonhearne
- Websites: Webperf Ninja / Andy Davies
Tim Kadlec: Mobile image processing
Tim spoke twice in one day at Velocity. As I understand it, this talk was his second talk as he was filling in for another speaker who couldn't make it at the last minute. Both talks were great, but this was by far my favorite of the two. The talk was absolutely fantastic and am glad I was able to see it.
We all kinda know that serving big images on mobile and underpowered devices isn't a great idea. Well, in his talk, Tim filled in the missing details to explain precisely why this is such a significant faux pas. Tim explained that for a browser to display an image, it needs to:
- Make the HTTP request to download the image
- Decode the image
- Copy it to the GPU
- Display the image
None of these steps are cheap. He focused on the expensive operations that occur in steps 2 and 3. For an image to initially be encoded, a computer must convert RGB to YUV, perform chroma subsampling, compress via DCT data quantization, and finally encode with Huffman's algorithm. Step 2 is concerned with reversing this whole process in order to get back to the original RGB values in order to eventually pain the pixels to the screen. Yes...there is a lot going on here.
In step 3, the decoded information is copied to and stored in GPU prior to painting. The big realization at this step is that you can quickly overwhelm the GPU's allotted memory because on many devices, the GPU is quite limited. Tim used an example 1280x520 px image to illustrate this point. The rough calculation is Bytes of memory = W x H x 4. Thus, this image uses 1280 x 520 x 4 = 2,662,400 bytes (2.54 MB) of memory. That's a ton of memory especially when you consider Jen Fitzpatrick's (VP of Product Management for Google Maps) quote from Google I/O this week:
25% of new Android phones only have 512 MB RAM
Further, Tim illustrated that if you were to process this image ahead of time and serve it at the intended display size (360x202), you get a significant savings: 360 x 202 x 4 = 290,880 bytes (0.00029 MB), 2.26 MB savings. Resize your images!
Tim then spent a lot of time on chroma subsampling, which is a process reducing color information in images to reduce the number of bytes in an image. I won't dive into it here, but it was a great primer on how to reduce image size without reducing noticeable quality.
To drive everything home, Tim discussed the time cost for rendering images, which broke down to:
| Image Size | Resized | Optimized |
|---|---|---|
| Resized | 30.38ms | 5.62ms |
| Double | 102.77ms | 27.74ms |
| Large (6x) | 1534.99ms | 462.11ms |
This is shocking! An image that is 6 times its display size could take up to 1.5s to display on a small screen, underpowered device, whereas, if sized appropriately, it might only take 30ms. The point is clear, handling your images for specific screensizes is an absolute must for good performance.
In summary, Tim made these four recommendations:
- Resize images
- Small breakpoints for large images
- Meta viewport is your friend
- Use 4:2:0 subsampling
- Slides: https://speakerdeck.com/tkadlec/mobile-image-processing-at-velocity-sc-2015
- Twitter: @tkadlec
- Website: http://timkadlec.com/
Ilya Grigorik: HTTP/2 is here: Let's optimize
What would Velocity be without a talk from Ilya? This was a highlight for me and a great way to end the conference. Ilya discussed the transition from HTTP/1.1 to HHTP/2, especially with regard to all of the performance hacks that we have championed in order to overcome the shortcomings of HTTP/1.1. Much of this material has been covered in Ilya's book, but this presentation addressed some updated information about the state of the protocol.
Rather than me going on about differences between HTTP/2 and HTTP/1.1, you should just read Ilya's book. It's a better use of your time; however, there were a few really interesting things that Ilya discussed that I want to highlight.
First, he provided a quote from Patrick McManus from Mozilla stating that HTTP/2 is already being used more that SPDY. Furthermore, as of May 26th 2015, Chrome telemetry is already showing that 45% of connections are being made over HTTP/2, with only 28% over SPDY and 27% over HTTP/1.1. HTTP/2 is already here. I feel like I've been waiting for it and didn't even realize that it's already in heavy use. I guess we just need Apache and Nginx to ship support!
Ilya proceeded to drop a bomb on the practice of domain sharding. If you are not familiar with it, domain sharding is a hack that allows you to open more than 6 TCP connections to your website. Modern browsers limit you to 6 TCP connections to a single domain, which prevents parallelism. To get around this, web developers would create more domains so more connections can be made (e.g., a.example.com, b.example.com). This is a hack to get around HTTP/1.1's lack of multiplexing. Ilya showed an Etsy case study that illustrated diminishing returns for this practice. Essentially, too much domain sharding can break congestion control leading to packet retransmission, which represents a performance loss overall. Done responsibly, domain sharding can still have a performance boost (just a few shards).
Fortunately for us, HTTP/2 brings true multiplexing allowing developers to stop using domain sharding; however, if you've been following these developments for some time, you likely have wondered, "how do I domain sharding for HTTP/1.1 and serve everything via a single domain for HTTP/2?" This is the part of the presentation where jaws dropped. Ilya explained that HTTP/2 will coalesce a connection if two domains are covered by the same TLS certificate and they resolve to the same IP address. In other words, you can use multiple domains on your site and they will share the same TCP connection if they use the same TLS certificate and resolve to the same IP address. Now, this isn't a recommendation or endorsement of the procedure; however, it does ease the transition to HTTP/2 if you are currently using domain sharding as a performance technique on your site.
This whole presentation was quite good and Ilya's slides are very detailed. I recommend a read through them if you are wanting to learn about the differences between HTTP/1.1 and HTTP/2.
- Slides: http://bit.ly/http2-opt
- Twitter: @igrigorik
- Website: https://www.igvita.com/
Zach Leatherman: The performance and usability of font loading
Webfonts present a major challenge for the modern web. They are beautiful, but come with a steep performance cost. Zach's presentation expertly explained exactly how fonts are rendered in a browser. This explanation was one of the clearest and most detailed explanations of font rendering behavior that I've ever seen or read. I highly recommend looking at some of the visuals in his slide deck as they make the concepts crystal clear.
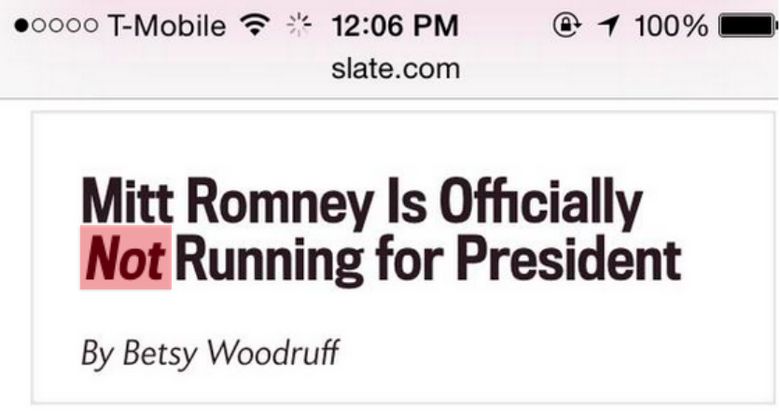
The main message I got from Zach's presentation is that Flash of Invisible Text (FOIT) and Flash of Unstyled Text (FOUT) should be first class concerns when building a website and thus, you must have a strategy for font rendering. I particularly enjoyed his emphasis on FOIT more so than FOUT. He demonstrated that FOIT can obscure the meaning of your content, whereas FOUT only lacks the font decoration yet maintains the meaning of the content. He showed a screenshot of a headline from Slate that appeared to say "Mitt Romney is Officially Running for President", when the real headline was "Mitt Romney is Officially not Running for President". The "not" did not render on the page immediately because it required another font download because not was in italics. Thus, FOIT obscured the meaning of this text (how ironic would it be if the italics I just used in this paragraph also didn't render? #FOITception).
You can see the results of FOIT below in the images he used to illustrate this point:

- Slides: https://speakerdeck.com/zachleat/the-performance-and-usability-of-font-loading
- Twitter: @zachleat
- Website: http://www.zachleat.com/
Mike Arpaia: osquery: Approaching security the hacker way
osquery has intrigued me since I first heard about it last fall; however, my intrigue was matched by confusion about what purpose the project serves. Part of the problem is that it is typically discussed as a security tool, which I now realize undermines its potential value for other use cases. In a perfectly vague manner, the osquery website describes it: "osquery allows you to easily ask questions about your Linux and OSX infrastructure". Fortunately, I got to attend Mike's talk and it helped cleared up what osquery is and does.
osquery allows you to gather system information via a SQL interface. For instance, I seem to find myself often trying to figure out what process(es) is listening to a specific port. I'll typically use netstat or lsof for this purpose, but the success of those utilities depends on the OS and my ability to remember the different arguments and switches for the commands. For instance, I might use nestat:
netstat -tulpnI'd get a result like:
(No info could be read for "-p": geteuid()=1000 but you should be root.)
Active Internet connections (only servers)
Proto Recv-Q Send-Q Local Address           Foreign Address         State       PID/Program name
tcp        0      0 0.0.0.0:443             0.0.0.0:*               LISTEN      -
tcp        0      0 0.0.0.0:80              0.0.0.0:*               LISTEN      -
tcp        0      0 0.0.0.0:22              0.0.0.0:*               LISTEN      -
tcp6       0      0 :::22                   :::*                    LISTEN      -
osquery presents a SQL interface to get that same information in a cross-OS manner. I know SQL. Developers know it; systems people know; it's ubiquitous. A driving idea behind osquery is that it makes this information easier to access because it uses a familiar interface. To get the port information using osquery, I'd do something like:
echo "SELECT DISTINCT process.name, listening.port, listening.address, process.pid \
  FROM processes \
  AS process \
  JOIN listening_ports AS listening \
  ON process.pid = listening.pid;" \
  | osqueryi
The result of this query is:
+------------------------+-------+---------------+-------+
| name                   | port  | address       | pid   |
+------------------------+-------+---------------+-------+
| UserEventAgent         | 0     | 0.0.0.0       | 295   |
| SystemUIServer         | 52763 | 0.0.0.0       | 312   |
| SpotifyWebHelper       | 4370  | 127.0.0.1     | 435   |
| SpotifyWebHelper       | 4380  | 127.0.0.1     | 435   |
| Dropbox                | 17500 | 0.0.0.0       | 452   |
| Dropbox                | 17603 | 127.0.0.1     | 452   |
| Dropbox                | 17600 | 127.0.0.1     | 452   |
| phpstorm               | 6942  | 127.0.0.1     | 6335  |
| phpstorm               | 56496 | 192.168.1.244 | 6335  |
| phpstorm               | 9876  | 0.0.0.0       | 6335  |
| phpstorm               | 63342 | 127.0.0.1     | 6335  |
| Ember Library Mediator | 5050  | ::1           | 6657  |
| Ember Library Mediator | 5050  | 127.0.0.1     | 6657  |
| VBoxHeadless           | 2222  | 127.0.0.1     | 7719  |
| VBoxHeadless           | 54015 | 0.0.0.0       | 7719  |
| Spotify                | 4381  | 127.0.0.1     | 12471 |
| Spotify                | 4371  | 127.0.0.1     | 12471 |
| Spotify                | 57621 | 0.0.0.0       | 12471 |
| ruby                   | 4000  | 127.0.0.1     | 13559 |
+------------------------+-------+---------------+-------+
How cool is that? There are hundreds of tables of information that you can access. With a quick look over the docs, I felt really comfortable surfacing information because it's all available in a table that I already know how to use.
In addition to Mike talking about osquery, he generally discussed the need for openness in the world of security. He discussed his frustration with the amount of secrecy around security tooling and expressed his interest in the need for more of these sorts of tools being built openly. To that effect, osquery is open source, and you guessed it, pull requests are welcome.
- Slides: https://speakerdeck.com/marpaia/osquery-approaching-security-the-hacker-way
- Twitter: @mikearpaia
- Website: http://arpaia.co/
Rasmus Lerdorf: PHP 7
One of the highlights of Velocity was being able to hear about PHP 7 from Rasmus himself. For those who don't know, Rasmus was the original creator of PHP (then know as Personal Homepage Tools). This talk focused on the new features in PHP 7, as well as the performance implications of the update. Since the new features are documented in many places, I will focus on the much more interesting performance improvements here.
The TL;DR is that PHP 7 is friggin' fast. Rasmus discussed using WordPress 3.6.0 as a benchmark for performance improvements in the PHP engine over the last year and a half. There were able to reduce the number of machine instructions and request time significantly by a factor of 3 and 2, respectively. This was attributed to a memory reductions related to zval and hastable optimizations.
Rasmus then proceeded to show a number of benchmarks of previous versions of PHP, PHP 7 and HHVM. The benchmarks were performed against popular PHP projects and frameworks (e.g., WordPress, Drupal, Magento, MediaWiki). In most cases, PHP 7 was leaps and bounds ahead of previous versions of PHP. PHP 7 and HHVM performance were quite similar. For some projects, PHP 7 was faster, and others, HHVM was faster. With regard to WordPress, PHP 7 and HHVM were neck and neck with HHVM edging out PHP 7. Rasmus showed that if you compile PHP 7 with GCC feedback-directed optimization (FDO; compiling PHP with awareness of the source code that it will be running), you can get identical performance for PHP 7 and HHVM. To do so, you can compile PHP 7 with the following command:
$ make clean
$ make -j8 prof-gen
...
$ sapi/cgi/php-cgi -T 1000 /var/www/wordpress/index.php > /dev/null
$ make prof-clean
$ make -j8 prof-use
Finally, Rasmus pointed to a PHP 7 Vagrant box that he is encouraging people to spin up and use to test PHP 7. Rasmus hinted of an RC for PHP 7 landing soon. Combined with a Tweet from elePHPant Offical, I'm assuming we'll be seeing it drop on June 8th.
- Slides: http://talks.php.net/velocity15
- Twitter: @rasmus
- Website: https://toys.lerdorf.com/
Allison McKnight: Crafting performance alerting tools
Any time someone from Etsy is giving a performance talk, you are in for a treat. Their performance monitoring and alerting systems are well thought out and practical and I really enjoy hearing about the different things that they are doing to make everyone on their team think about performance. Allison's talk focused specifically on how Etsy's performance team (of which she is part of) added alerting to their suite of performance monitoring tools. It's no secret that Etsy's engineering teams graph everything. Allison even quoted what seemed to be an internal mantra, "If it moves, graph it; even if it doesn't move, graph it anyway because it might someday."
Allison explained that this level of monitoring is helpful, but can be overwhelming for engineers because there is so much to monitor. Thus, she set out to find useful ways of alerting the team when there was a noteworthy performance regression. She documented how their team uses Nagios for alerts because the software is well integrated at and understood across Etsy. She wrote an app that allowed her to view performance graphs for metrics that were important and set arbitrary alerting thresholds for the metrics. Allison documented the struggle to get the thresholds right and ultimately landed on a method of manually "eyeballing" it. It seems to be working well for her team. She also walked through the iterative improvements to the alert emails that she made, which currently highlight the most important information about the event and even provide a graph of the performance.
The point of this talk was not to give a play-by-play of how to set up a state of the art performance alerting system, but rather to tell the story of the challenges that Etsy's team have faced. I appreciated Allison's clear delineation of the problems and her documentation of the things they did to solve the issue.
A few resources that Allison shared during the talk:
- Logster: Logster monitors and parses logs to turn the information into useful metrics.
- Nagios Herald: This Nagios extension allows you to create more meaningful Nagios alerts. It can be used to generate helpful information to be sent along with an alert to automate many of the on-call engineer's tasks by doing them as part of the event escalation.
Thanks for the great talk, Allison!